Connecting to the openELISPOT
You can use the openELISPOT in two ways:
Option 1: Connect a monitor, mouse and keyboard directly to the openELISPOT (via the HDMI port on the left side, and USB ports on the top)
- We have provided a wireless keyboard/trackpad. To use this, insert 2X AA batteries into the keyboard and plug the USB unifying receiver into the top of the openELISPOT main unit. Alternatively, you can use your own USB keyboard and mouse.
- Once openELISPOT has booted up, you should see two shortcuts on the desktop. openELISPOT Dashboard and openELISPOT Analyse.
Option 2: Connect to the openELISPOT’s WiFi network, then access the openELISPOT dashboard from a browser on your computer or phone (we recommend using a computer for the larger display)
- Connect to the openELISPOT’s WiFi network (SSID: openELISPOT, password: openelispot)
- Open a browser window and go to: http://openelispot.local
- You should now see the openELISPOT dashboard
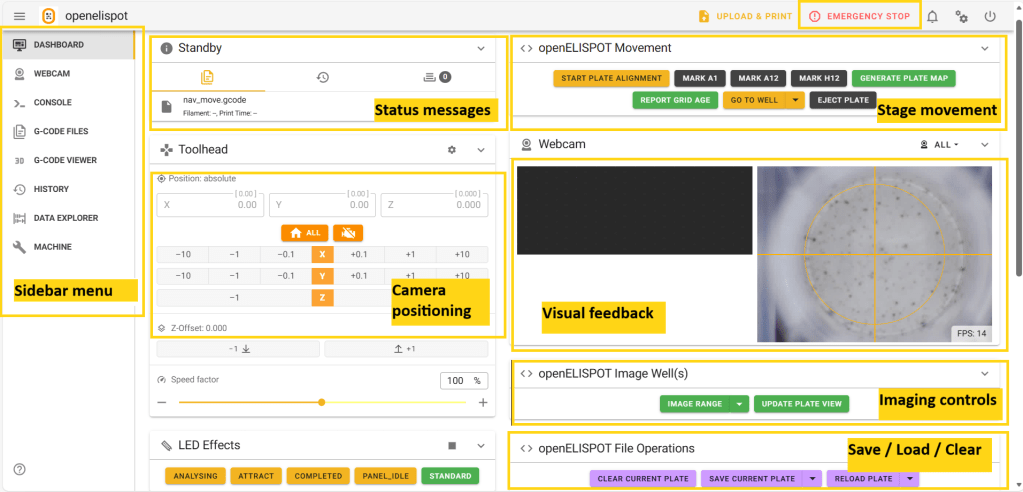
The Console interface consists of groups of functionally-related controls
Focusing the Camera
In the ‘Sidebar menu’, select ‘Dashboard’.
- In the ‘Toolhead’ menu, click motor off:

- In the ‘Sidebar menu’, select ‘Webcam’.
- Manually move the stage so that the bottom of a well with spots is visible.
- Open both electronics panels of the instrument. The lens at the front of the instrument twists to focus. Using both forefingers, adjust the lens to obtain a sharp image.
- Close the covers.
Configuring Plate Geometry
- In the ‘Sidebar menu’, select ‘Dashboard’.
- In the openELISPOT Movement panel, select ‘Eject Plate’. The stage will move to the far left corner, engaging the limit switches, and then move to the operator’s near right.
- Open the plate pincher (yellow corner) of the stage, place plate with well A1 at upper left, and close pincher.
- Select ‘Start Plate Alignment’. The plate will move near well A1, but will require manual adjustment. Note the messages in the ‘Standby’ panel (Status messages).
- Using the controls in the Toolhead panel (labelled ‘Camera Positioning’), adjust the X and Y position so that the yellow reticule in the Webcam panel (labelled ‘Visual feedback’) is entirely within the edge of well A1. Use +/-10 for large steps, and +/- 0.1 for fine adjustments. E.g. the image in the picture requires a fine adjustment of ~X+0.3.
- When A1 is correctly aligned, click Mark A1. The camera will move to near well A12. Repeat the process to align well A12, and then well H12.
- Click ‘Generate Plate Map’ to create a record of the centre co-ordinates of all 96 wells. The software will briefly restart to load in these values, which are computed in the background.
- Check the plate map by clicking on ‘Report Grid Age’ (should list the current date time and not the previous calibration (2026-03-23 at 13:31:27)). Use ‘Go To Well’ to navigate to well F6, and check alignment.
- If necessary, repeat the process to refine the map. Note plates with strips may have some irregularity, this can usually be handled in analysis.
- Additional plates with the same geometry are unlikely to need re-calibration. Currently, it is not possible to save a geometry.
Reading the plate
- In the ‘Sidebar menu’, select ‘Dashboard’.
- Following the steps above, ensure the camera is focused, and the plate is loaded and calibrated.
- Check the plate view in the ‘Webcam’ panel (Visual feedback) is empty (completely black) and ready to store a new set of images.
- Click the arrow part of the ‘Image Range’ button in the ‘openELISPOT Image Well(s)’ panel to the to display settings dropdown.
- Enter the start and end row and column for imaging. The reader will proceed from top left to bottom right imaging all wells in the specific range.
- If required, adjust the resolution: ‘4056 x 3040’ (default), ‘3264 x 2448’, ‘2592 x 1944’, ‘2028 x 1520′ (recommended low res mode 2x binned), 1632 x 1224’.
- Click ‘Send’.
- The video feed from the camera will be suspended during acquisition. The plate map will be automatically updated after imaging is complete (this process can take >30 seconds for a full plate).
- Plate data is stored in a temporary directory and must be saved prior to acquiring new plates (see below).
Saving plate data
- In the ‘Sidebar menu’, select ‘Dashboard’.
- Click the arrow part of the ‘Save Current Plate’ button.
- Enter a reference for the specific plate. All plates will be saved with the prefix DD-MM-YY-[reference]. If you wish to use spaces, enclose the reference in single quotes ”.
- Click ‘Send’.
- Clear the plate from the temporary storage by clicking ‘Clear Current Plate’.
Analysis using openELISPOT Data Manager
Loading a Plate for Analysis
- When you first load the Data Manager, you will see example plate data loaded in.
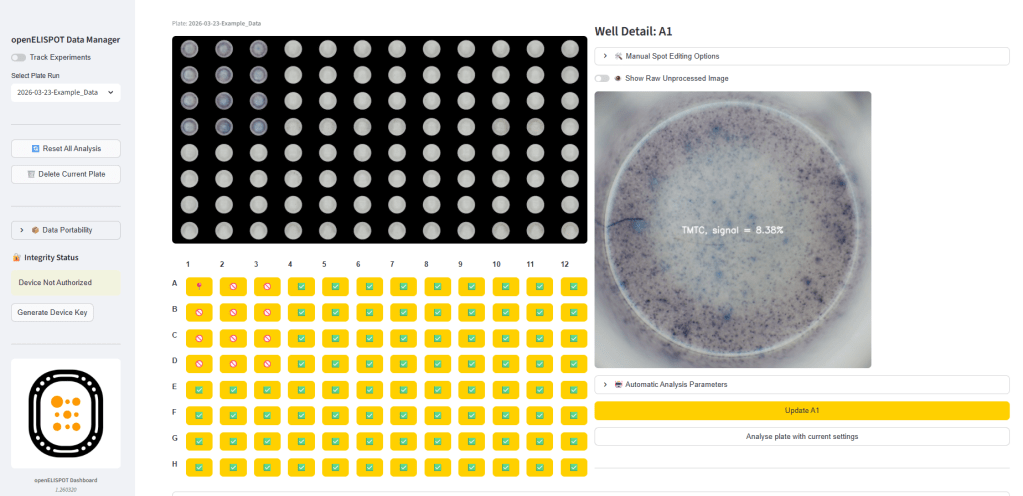
- The interface is in three columns. On the left, the ‘Sidebar’ contains file operations and status messages. In the middle, the currently-selected ‘Plate layout’ and ‘Well selection’ icons are displayed. The selected well ‘Well Detail’ and analysis settings are shown on the right side.
- If necessary, load your new data set using ‘Select Plate Run’ in the sidebar.
If an experiment comprises multiple plates, they can be added to a single experiment. See section below on ‘Experiment mode’.
Counting spots
- Navigate your plate using the well selection icons. Select a representative well to adjust analysis settings.
- Open ‘Automatic Analysis Parameters’
- Each control is explained in the Tooltips (?) next to each slider. The following settings are recommended as a starting point:
Use Otsu: off
Threshold: 20
Watershed: 0.3
Well Radius: 0.27
TMTC Threshold: 12.5%
Doublet Intensity Ratio: 1.5
Min Area: 10
Max Area: 1000 - Click ‘Update [WellID]’
- Identified spots will be added to the Well detail image. The overlay can be toggled on and off with the ‘Show raw unprocessed image’ switch.
- Adjust the parameters so that the counted spots match expectations by eye as closely as possible. This will require some iteration!
- Click ‘Analyse plate with current settings’. The software will then process all well images on the current plate.
Manual Addition and Removal of Spots
- Controls to manually add or delete identified spots are above the Well Detail image – ‘Manual Spot Editing Options’
Experiment mode
- Experiment mode can be toggled on using the switch in the sidebar. In this mode, a set of plates can be analysed and exported together (see exporting results, below).
Exporting results
- Results are recorded automatically. Multiple plates can be analysed without exporting data, depending on the capacity of the SD card.
- Data is displayed in the expanders below the well selection icons. Within ‘Current Plate Data Table’, the information can be exported using ‘Download CSV’ to a spreadsheet programme.
- Plate analysis data can be deleted using ‘Reset All Analysis’ in the Sidebar. This affects the current plate only.
- Plate data (including images) can be deleted using ‘Delete Current Plate’. This is unrecoverable.
- A zip file of all data (images and numbers) can be prepared using the ‘Data Portability’ dropdown in the sidebar.
